Non-monophyletic genera
Non-monophyletic-groups.RmdIf a species is missing from the megatree and the genus of that
species in the megatree is non-monophyletic, where should we bind it to?
I can think about two options to deal with this. The first is to use the
most inclusive MRCA as what rtrees uses now. The other is
to use the MRCA of the largest cluster of the genus. In my opinion, if a
species is missing it probably means that we know little about that
species; and the safest option is to bind it to the MRCA of all
congeneric species from the megatree.
To compare these two options, I have created a branch on GitHub
(largest_cluster, just a prototype at this moment) to
implement the later option. I then conducted 1,000 simulations. For each
simulation, I randomly sampled 500 species from the 3,000 tips of a
subset tree of megatree megatrees::tree_fish_12k. I used a
smaller subset tree (referred as megatree afterhere) instead of the
megatree itself to save computational time. For phylogenetic diversity
comparisons, these 500 species form a community assemblage. For
phylogenetic signal, I simulated values of a continuous trait of these
500 species following a Browian motion model with sigma of 1. I then
randomly dropped 200 species out of these 500 species from the megatree
(thus we know the ‘true’ phylogeny). I then recreated the phylogeny of
these 500 species by grafting the 200 species back to the megatree using
the two approches to deal with non-monophyletic genera mentioned above.
I then compared the phylogenetic diversity values (Faith’s PD, Mean
Pairwise Distance MPD, and Mean Nearest Taxon Distance MNTD) based on
different scenarios against with the values calculated based on the
‘true’ phylogeny. Phylogenetic signals were estimated using the
phytools::phylosig() function with the method of ‘K’ and
‘lambda’. The simulation codes can be found here.
From the results, we can see that these two approaches give similar results (both have slopes of ~1 when regressed with ‘true’ values). As for phylogenetic diversity, what we care is the relative values comparing with other communities in most cases. Therefore, the slopes, instead of the absolute differences between estimated values and ‘true’ values (histograms in Fig. 1 A-C), are the most important thing. These results suggested that the current approach (inclusive) to graft species to non-monophyletic group works well and there is no significant benefit gained with the largest cluster approach.
Therefore, I decided to not implement the second option in the main branch to make it simpler for users.
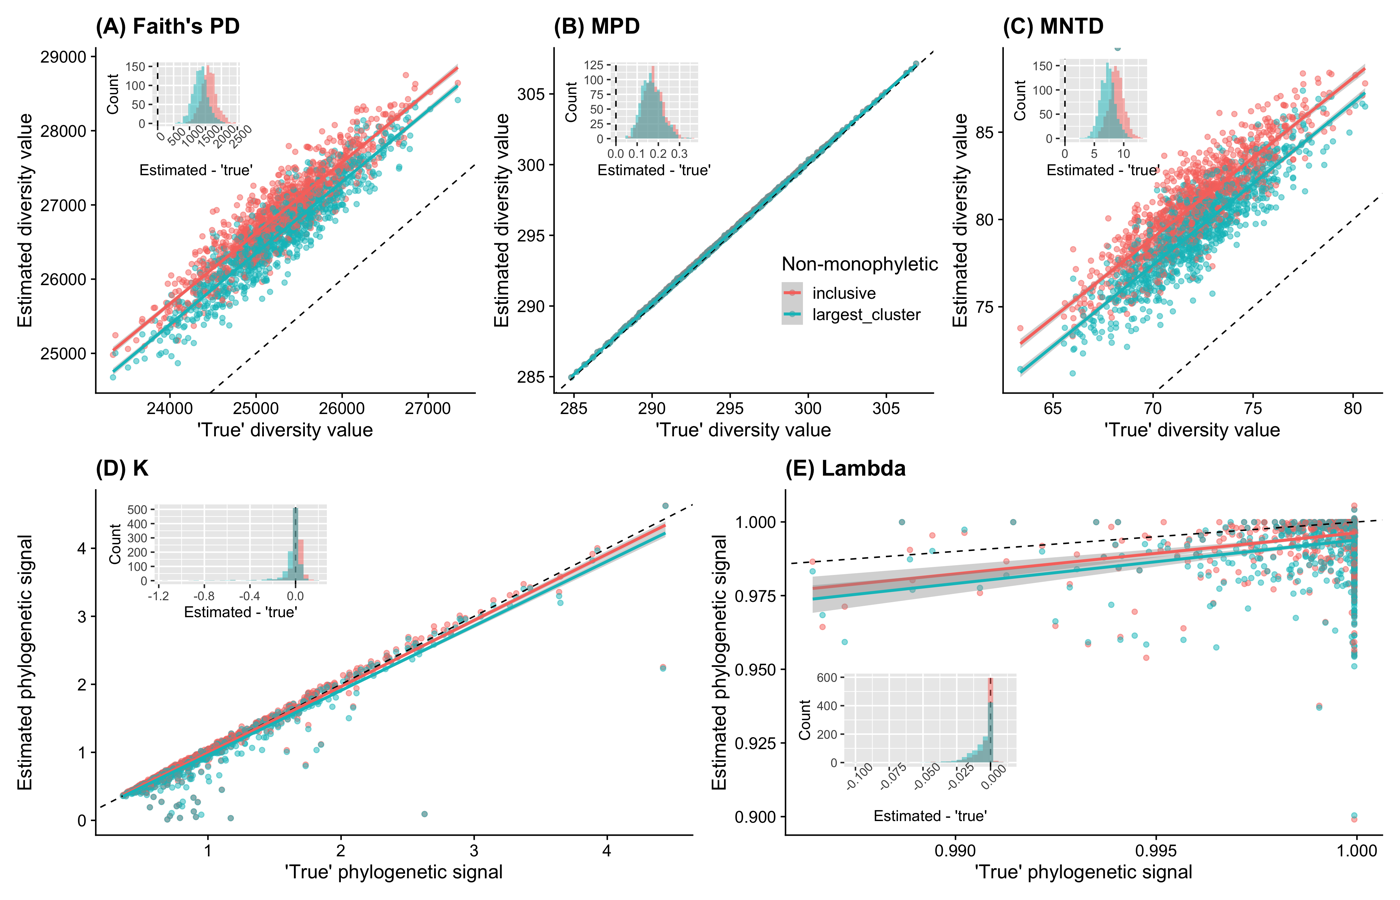
Effects of different approches to graft species to non-monophyletic genera on phylogenetic diversity. Black dashed lines represent 1-to-1 relationships (intercept = 0, slope = 1). These results suggested that the current approach (inclusive) to graft species to non-monophyletic group works well and there is no significant benefit gained with the largest cluster approach.