Grafting Scenarios
grafting_scenarios.RmdNote: part of the purpose of this vignette is to demonstrate
that one of the previous grafting scenario (“at_or_above_basal”, which
is equivlent to the “S3” in V.PhyloMaker) is not needed and has been
removed from rtrees since v1.0.1. The other part of the
purpose is to demonstrate that the default option is generally enough
for most cases.
To evaluate the effects of the placements of grafted taxa
(“at_basal_node”, at_or_above_basal” and “random_below_basal”) on
downstream phylogenetic analyses (specifically, community phylogenetic
diversity and phylogenetic signal of traits), I have conducted 1,000
simulations. For each simulation, I randomly sampled 150 species from
the 3,000 tips of a subset tree of megatree
megatrees::tree_fish_12k. I used a smaller subset tree
(referred as megatree afterhere) instead of the megatree itself to save
computational time. For phylogenetic diversity comparisons, these 150
species form a community assemblage. For phylogenetic signal, I
simulated values of a continuous trait of these 150 species following a
Browian motion model with sigma of 1. I then randomly dropped 50 species
out of these 150 species from the megatree (thus we know the ‘true’
phylogeny). I then recreated the phylogeny of these 150 species by
grafting the 50 species back to the megatree using the different
grafting scenarios. For the “random below basal” option, I generated 200
phylogenies and calculated the average phylogenetic diversity and
phylogenetic signal value to compare with the other scenarios. I then
compared the phylogenetic diversity values (Faith’s PD, Mean Pairwise
Distance MPD, and Mean Nearest Taxon Distance MNTD) based on different
scenarios against with the values calculated based on the ‘true’
phylogeny. Phylogenetic signals were estimated using the
phytools::phylosig() function with the method of ‘K’ and
‘lambda’. Code used for simulations can be found here.
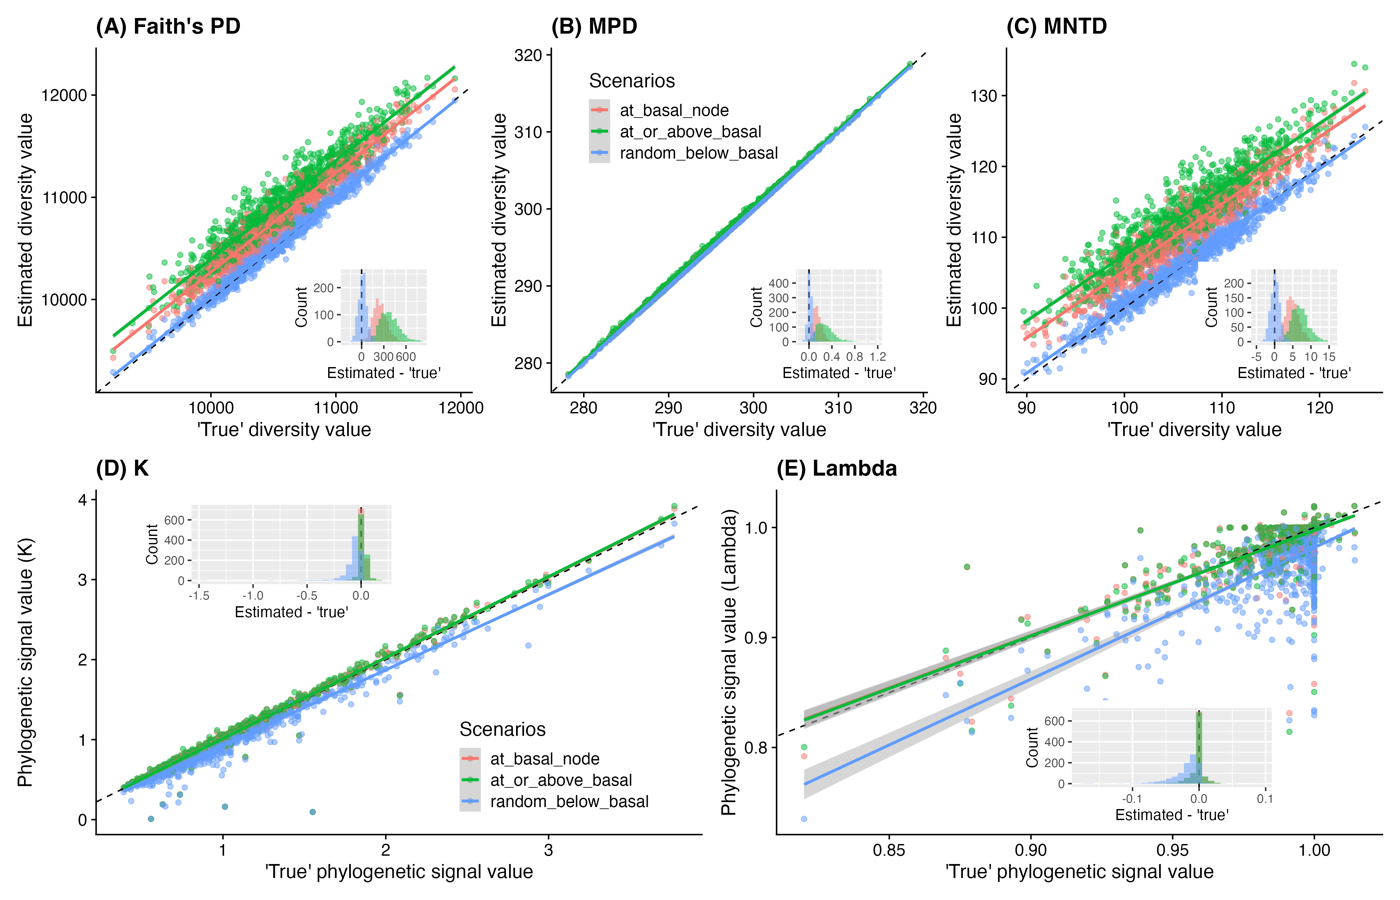
Effects of different grafting scenarios on results of community phylogenetic diversity (A-C) and phylogenetic signal of traits (D-E). Black dashed lines in the larger regression plots represent 1-to-1 relationships (intercept = 0, slope = 1). Nested histograms present the distributions of differences between estimated values based on the phylogenies derived with different grafting scenarios and the true phylogeny.